- Home
- Financial Statements
- Sample Financial Reports
Sample Financial Reports
Using QuickBooks®

by L. Kenway BComm CPB Retired
Published May 2009 | Updated June 19, 2024
WHAT'S IN THIS ARTICLE
Introduction | What is a Balance Sheet | What is an Income Statement | What is a Cash Flow Statement | Wrap-Up | Image Index of Financial Reporting
Two Sample Financial Reports
Sample financial reports using QuickBooks® are presented here ... because sometimes a picture is better than words ... especially if you are a visual learner.
These two sample reports show how your profit and loss report interacts with the balance sheet.
These basic bookkeeping reports are in the standard accounting format. The first set of financial reports is what you could expect if your were using QuickBooks® EasyStart software.
As EasyStart software is made for small businesses with basic accounting needs such as simple invoicing needs and all expenses by debit or credit card are paid immediately (i.e., no accounts payable). Inventory is not an available feature but you can track your mileage. QuickBooks Online also gives you access to a cash flow dashboard.
What is a Balance Sheet?
A balance sheet discloses how healthy your business really is. Be cognizant of who you share it with as it is really, really revealing and tells people who know how to read a lot (and I mean a lot) about your business.
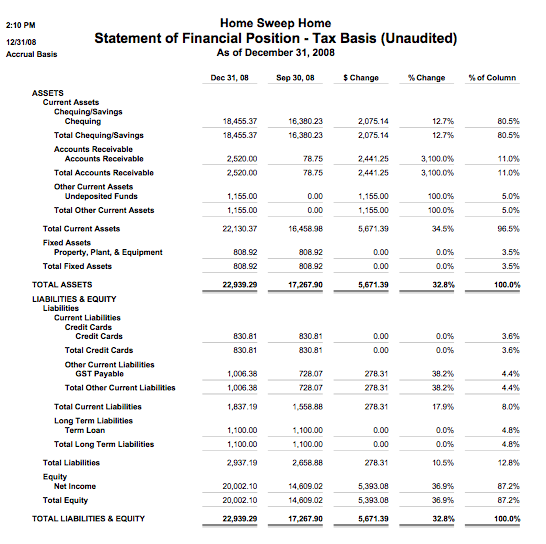
Here is a basic balance sheet for a home based business.
What is an Income Statement?
An income statement discloses how you made your profit! Or how you made your loss :0( It is prudent to watch your income statement carefully so you can take corrective action before you have a real problem.
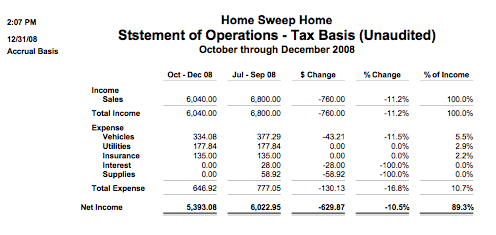
Here is a very basic income statement. This business is home based and does not have any inventory so the cost of goods (COGS) is not shown on it.
Side Note: Sorry about the typo in the title of the report ... my bad!!! :0(
Comparative Statements
I formatted the above bookkeeping example as comparative statements. The current accounting quarter is compared to the previous quarter. If the prior year provides a better comparative for your business, it is very easy to reformat the QuickBooks report.
- You'll also notice that I arranged the expenses from the highest to lowest instead of alphabetical order which allows you to focus on the expenses that drive your business. In QuickBooks®, this is easy to do. You do not have to manually rearrange your chart of accounts. Just customize your report to sort by amount.
- Sometimes the QuickBooks® comparative reports are referred to as Diagnostic Reports. This is because they can help you see trends.
Take the sample financial report - the Income Statement above as an example. Sales are down 11% this quarter. It could be seasonal which you were expecting ... or you may have a problem surfacing ... finding out now gives you time to react quickly.
The good news in this example is your expenses are under control as you can see they are down 17%. If they had been rising while your sales were falling, you would need to take some corrective action. Expenses have a tendency to creep higher if you don't monitor them carefully. - The other item I formatted in these examples of basic bookkeeping forms is the "% of Column" and "% of Income". Sometimes a percentage amount has more meaning to you than an actual number. It helps you place the numbers in perspective.
You can quickly see in this bookkeeping example that 80% of the assets are cash (I wish this was the case in my business!) and the expenses are only 11% of the current income (I really really wish this was the case in my business!).
In reality, that is a lot of cash sitting in a bank account ... and this company doesn't seem to have large cash demands. This owner could perhaps consider opening a business savings account and earn some passive income on this asset.
So the diagnostic report or comparative report is very useful to help you run your business ... but only if your books are up-to-date and accurate.
What is a Cash Flow Statement?
I don't have a sample Statement of Cash Flows but let's just briefly cover what you'll find in one. A cash flow statement shows the changes in your cash position for a particular period. Basically you can see the source of the cash coming into the business and the how the cash was spent.
In QuickBooks Online, a statement of cash flow is divided into three parts:
- Cash from Operating Activities - sales revenue and other cash receipts, expenses to run your business including overhead expenses as we all as taxes.
- Cash from Investing Activities - sale of business assets other than inventory, loan to others or loan payments received, and other unusual sources of income as well as purchase of capital assets.
- Cash from Financing Activities - money borrowed, proceeds of sale of the company's securities as well as debt servicing and dividend payments.
Wrap-Up
QuickBooks sample financial reports can be customized to help you run your business. Four customizations I always recommend are:
- Customize the title so third party readers know what they are looking at.
- Adjust the default report so it is comparative to another period of your choice - whichever period is the most relevant.
- Sort your income and expenses by amount instead of alphabetically so you can see at a glance the numbers that are driving your business.
- Add a "% of Column" and "% of Income" to put the numbers in perspective quickly. This is especially helpful for the "I don't do numbers" crowd.

It's been great chatting with you.
Your Tutor
Learning How To Read Your Internal Financial Reports
Tools for the Home Based Business Owner
 How Your Financial Plan Is A Road Map
 Why You Want The New NTR Report
Bookkeeping Essentials> Free Accounting Training> Sample Financial Statements
Home> How To Read The Balance Sheet> Sample Financial Statements
